What is the point of using a tool like Google Analytics 4 (GA4)?
You can ask GA4 questions about how your business is performing, and get answers which can help guide you in making business decisions that will drive revenue.
What sort of questions can you ask that will be revelatory? Here are a few that I ask, and how I go about answering them.
What exact traffic sources are driving my revenue? Which should I invest more money into, and which should I avoid?
In order to understand this, I've made a customized table, seen below (I'm using data from the GA4 demo account here). It is based on the "Session primary channel group" table found in Reports > Life Cycle > Acquisition. From there, I've clicked on the "Open this report as an exploration" option in the top right, which gives you much more customization over the data you see.
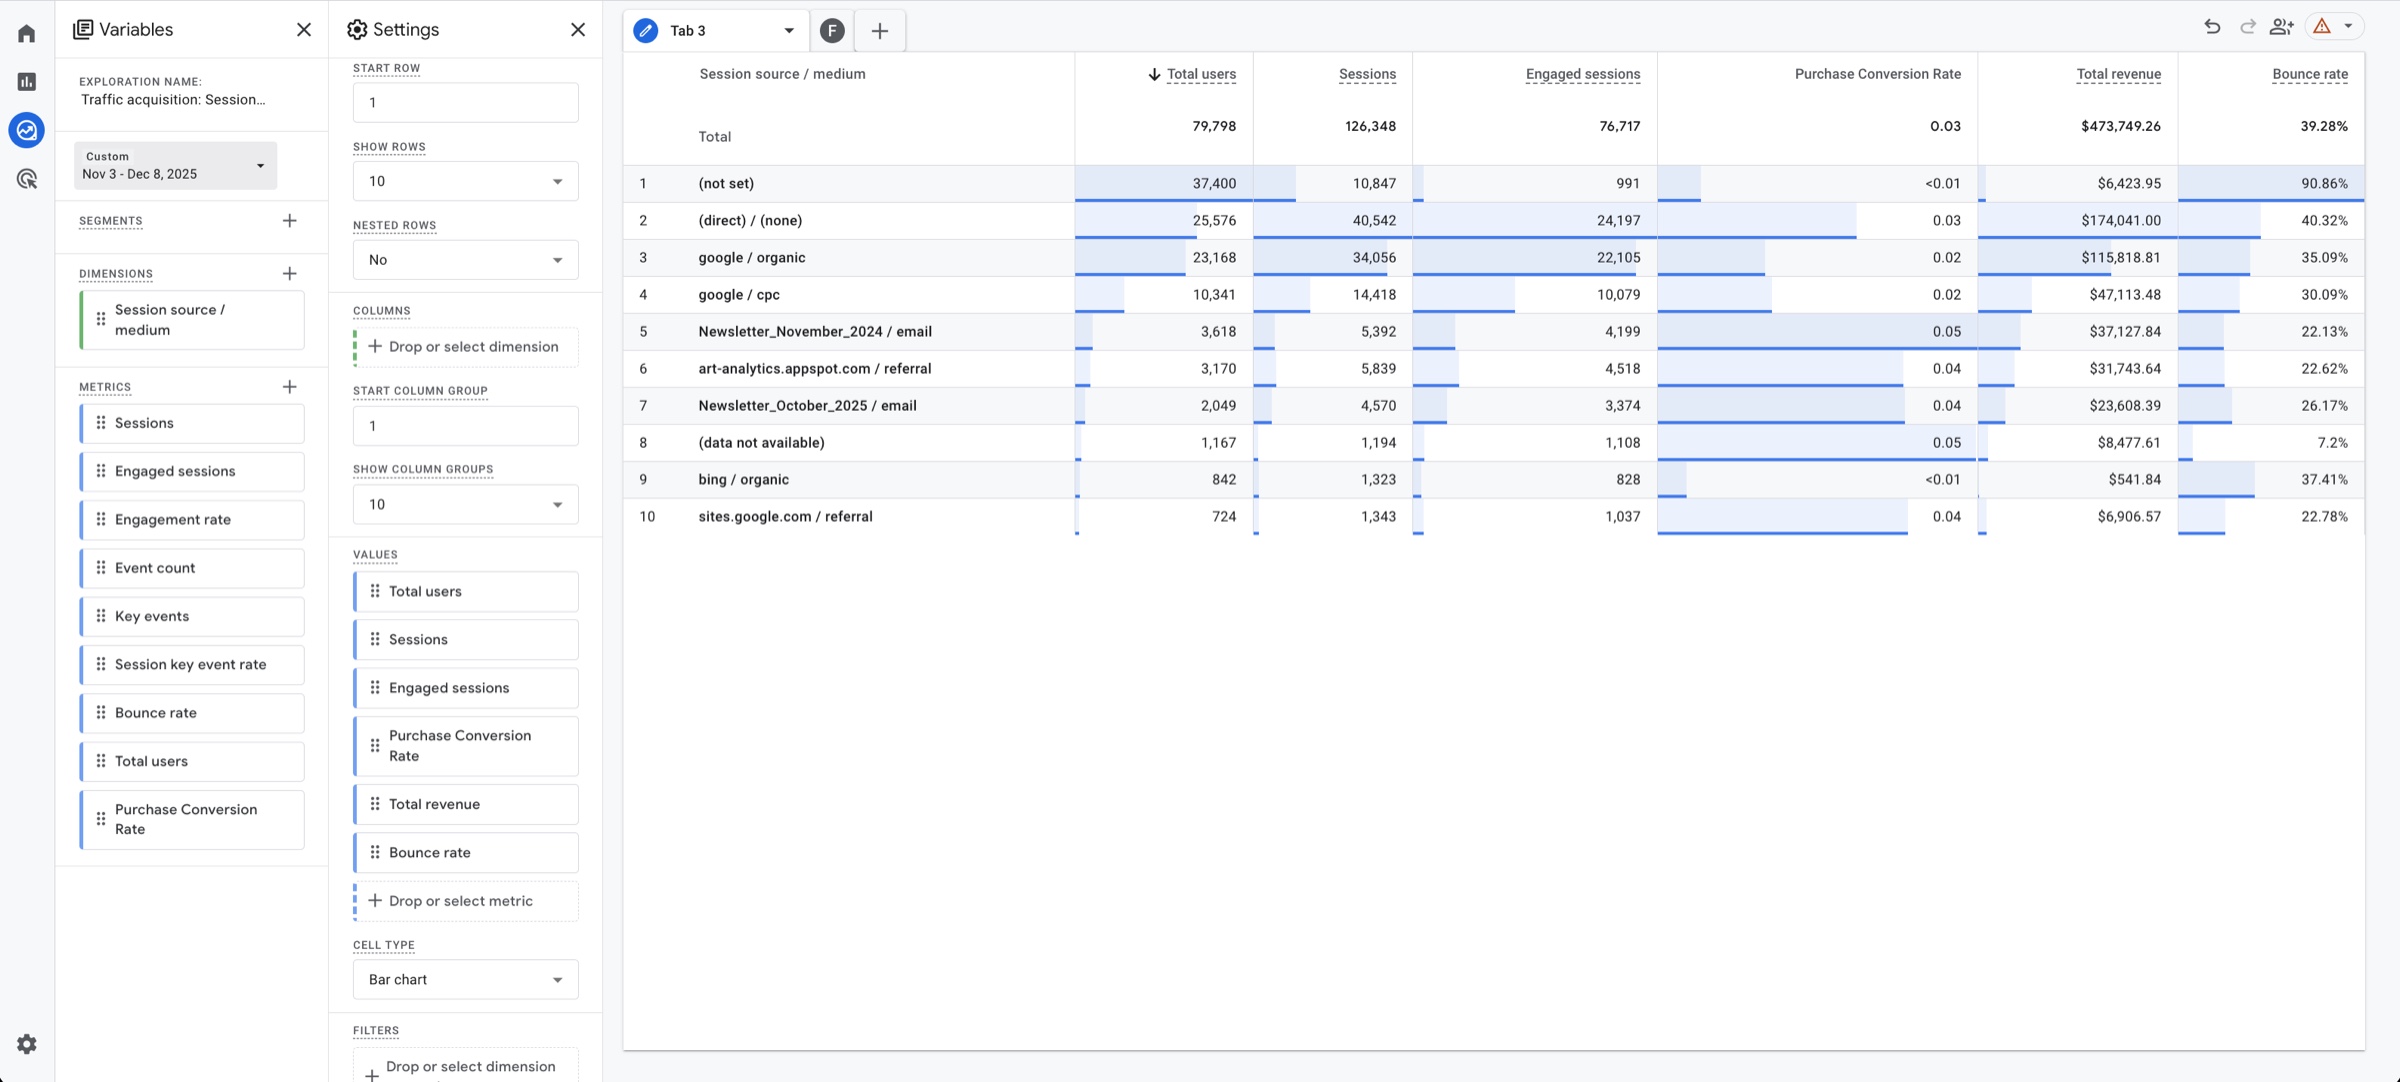
The key customizations that I made in order to answer this question are:
- Change the standard "Session default channel group" to "Session source / medium" (first column in the table). This breaks down not only the source of the traffic, but also the method by which that traffic was acquired. Ie: "google / cpc" means a user came from google by clicking on an ad, while "google / organic" means they came by searching for us on Google and clicking a search result.
- I've added "Purchase Conversion Rate," which shows the rate at which a user became a customer.
- I've added the "Bounce Rate," to understand how often people came to the site and left without interacting (low quality traffic).
- Deleting all the other columns that we don't need to look at to answer this question.
With this information, I can see which exact channel is giving me traffic, and what traffic is actually making purchases.
In this example, the most effective paid acquisition channel is Google advertisements. However, another source of high quality traffic is Newsletters, which have the highest conversion rate of all the acquisition channels. This indicates that newsletters may be a good place to place focus on.
I just made changes to a certain page. Are the changes making people more engaged? Have the changes led to conversions and revenue?
This is fundamentally a CRO question. Have the CRO changes you've made worked?
For this, we will look at engagement and conversion data for the page in question before and after the changes. This is a custom table based on Reports > Engagement > Pages and screens. From there, I've once again clicked on the "Open this report as an exploration" option in the top right for more customization.
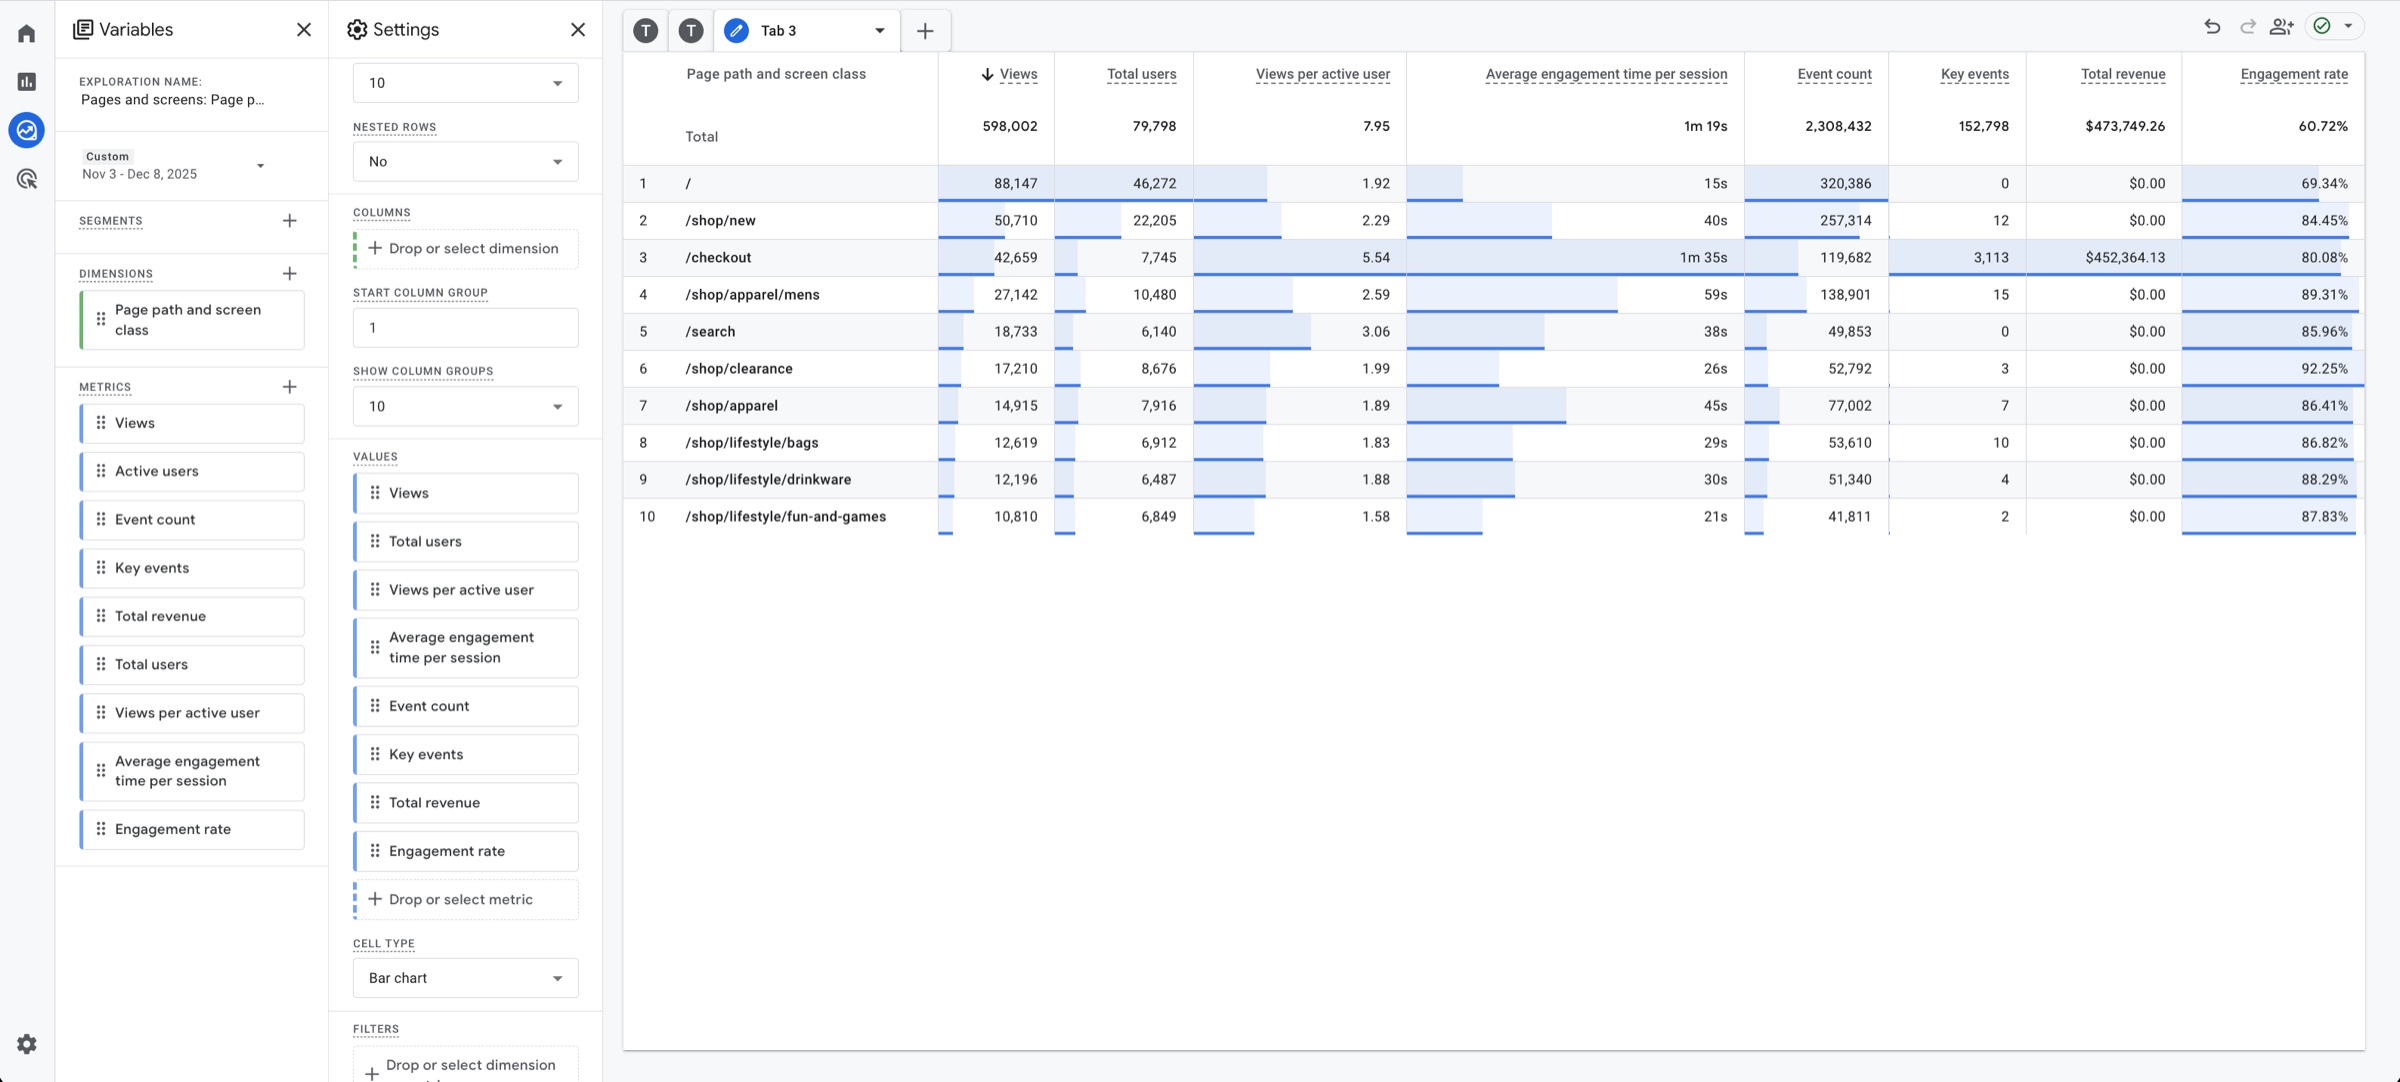
The key customizations that I made in order to answer this question are:
- Added "Engagement rate"
- Added "Average engagement time per session"
- Added "Total users"
- Deleting all the other columns that we don't need to look at to answer this question.
Now the comparison is done by changing the date ranges on the left. Let's say you made major changes to the home page (denoted as "/" here) by adding a bunch of UGC reviews with pictures and videos. What was the engagement rate for the week before the CRO changes were made? The week after? Did the total amount of revenue increase?
This insight is very easy to see once this custom view is created.
Where are users dropping off in their purchase journey? What pages do I have to focus on optimizing in order to drive revenue?
Another CRO question, focussed slightly differently. There are a few ways to answer this question, but the one I'll talk about here looks at the purchase journey.
If you are getting lots of traffic to site, but not many people are clicking on any products, it can reveal that you need to redesign UI. Or if a significant portion of people who add to cart never begin checkout, it can reveal that something is missing in your offer or in your UX.
This is revealed in the Reports > Monetization > Purchase Journey.
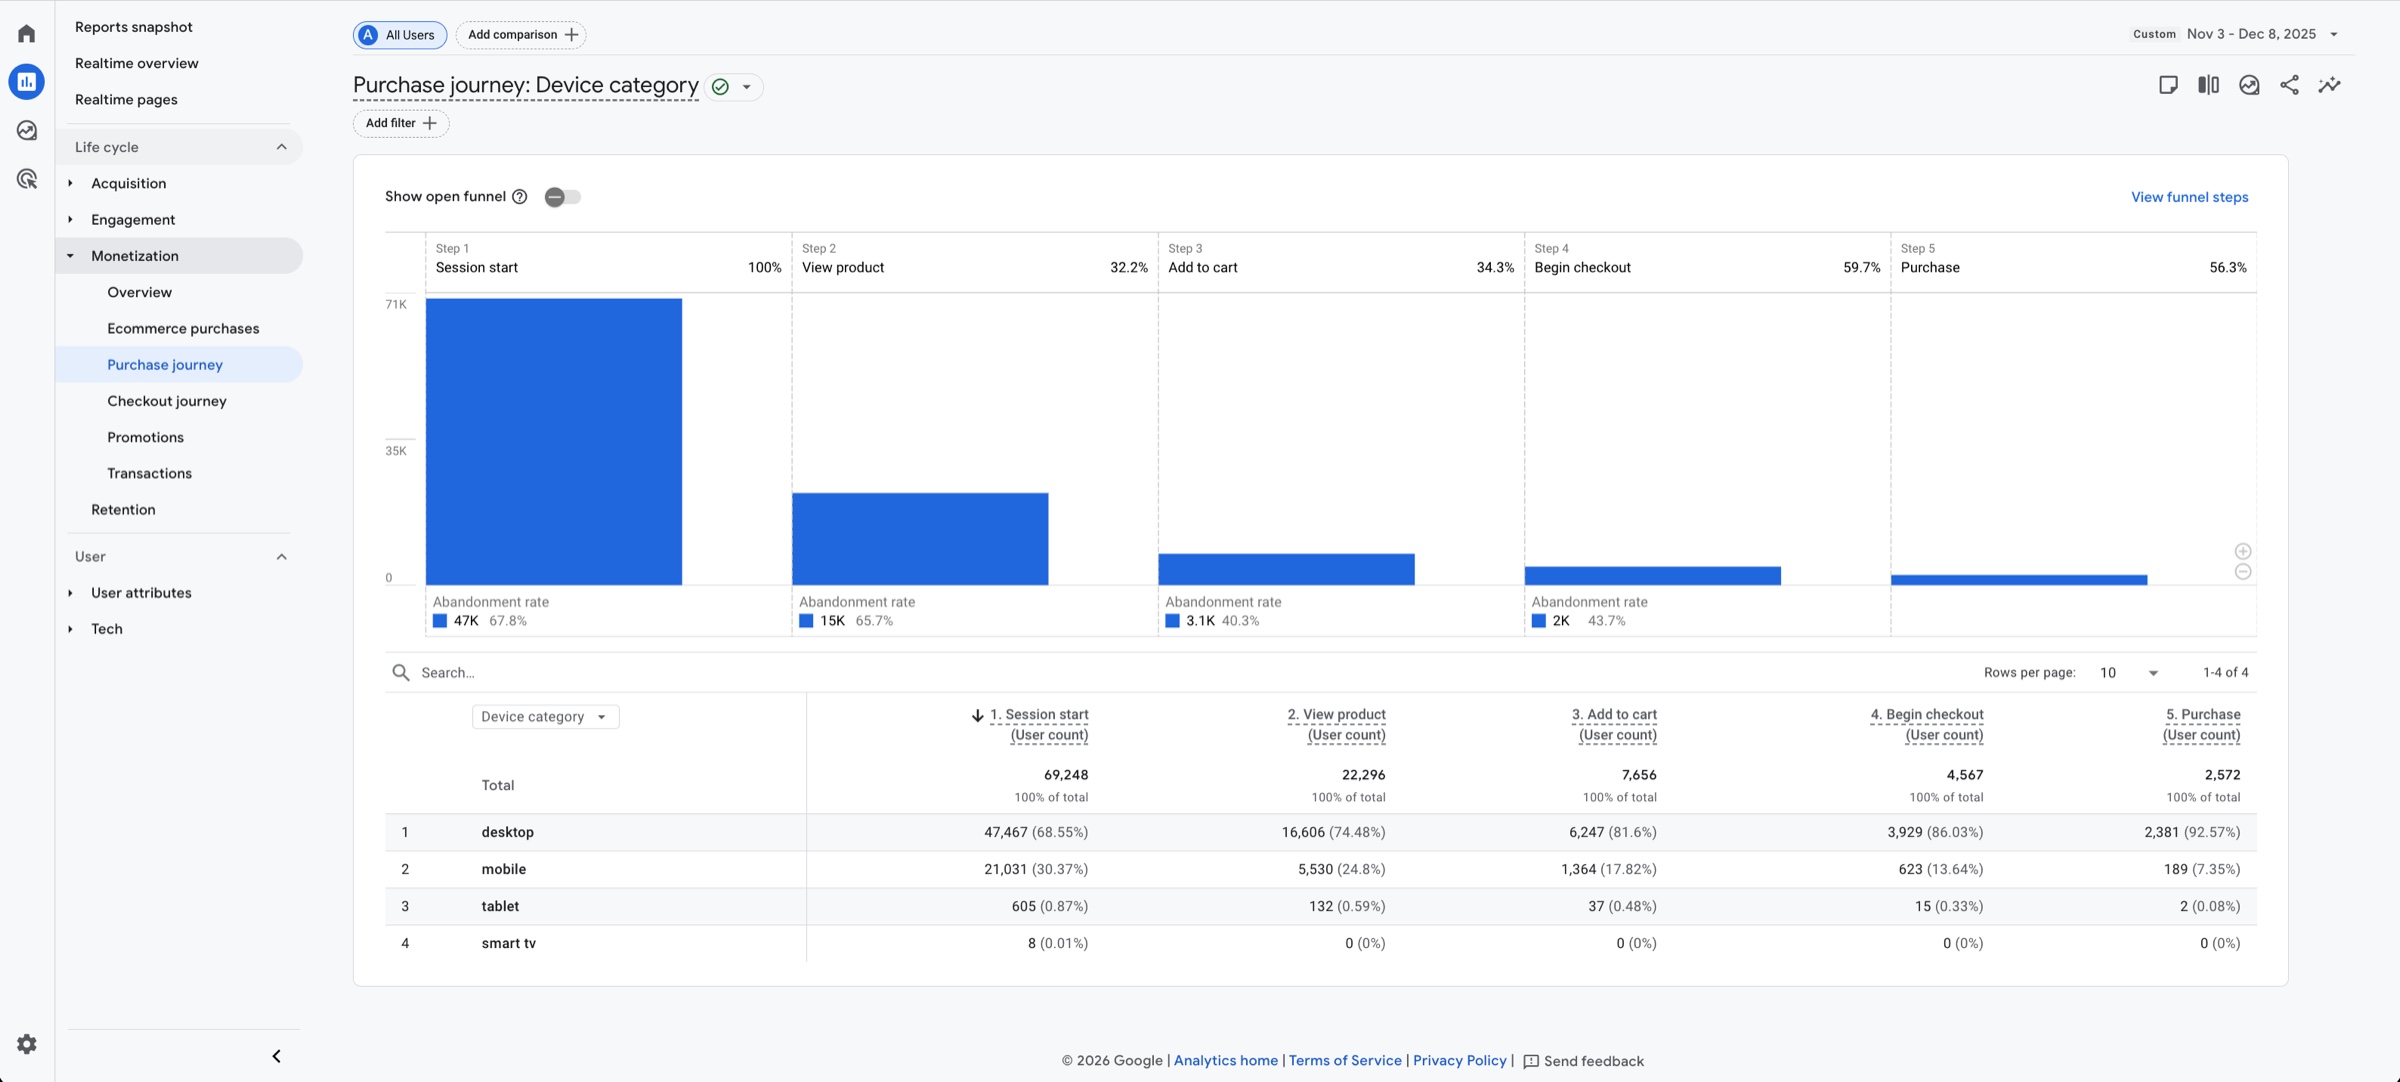
Basically, it shows that of the people who land on your site, how many of those people move through to the next step in your funnel, and how many drop off. By looking at this data, we can see what the bottleneck in the purchase journey is. In revealing the bottleneck, one has the opportunity to address it and convert more of the traffic already arriving on your site.